Embedding-Enhanced Psychometrics
In developmentAn R pipeline that compares the latent structure of LLM text embeddings with human psychometric data using Exploratory Graph Analysis (EGA) — using language models as a new lens on construct validity, factor structure, and scale design.
Psychometric instruments are carefully built to capture latent psychological constructs — depression, personality, functioning. Large language models, trained on vast corpora of human text, have implicitly absorbed a great deal of knowledge about that same psychology. How well does an LLM’s semantic understanding of a scale’s items reflect the dimensional structure those items were designed to measure — and is the way an LLM embeds that content equivalent to how humans actually respond to it?
This pipeline offers a systematic, reproducible way to answer that question. It compares the latent dimensionality uncovered by Exploratory Graph Analysis (EGA) applied to human response data against EGA applied to LLM text embeddings of the same items, producing side-by-side network visualisations and a suite of quantitative similarity metrics. The goal isn’t to replace human data — it’s to use LLMs as a new lens on construct validity and factor structure, and to simulate and refine measurement instruments before collecting real human data.
The core idea
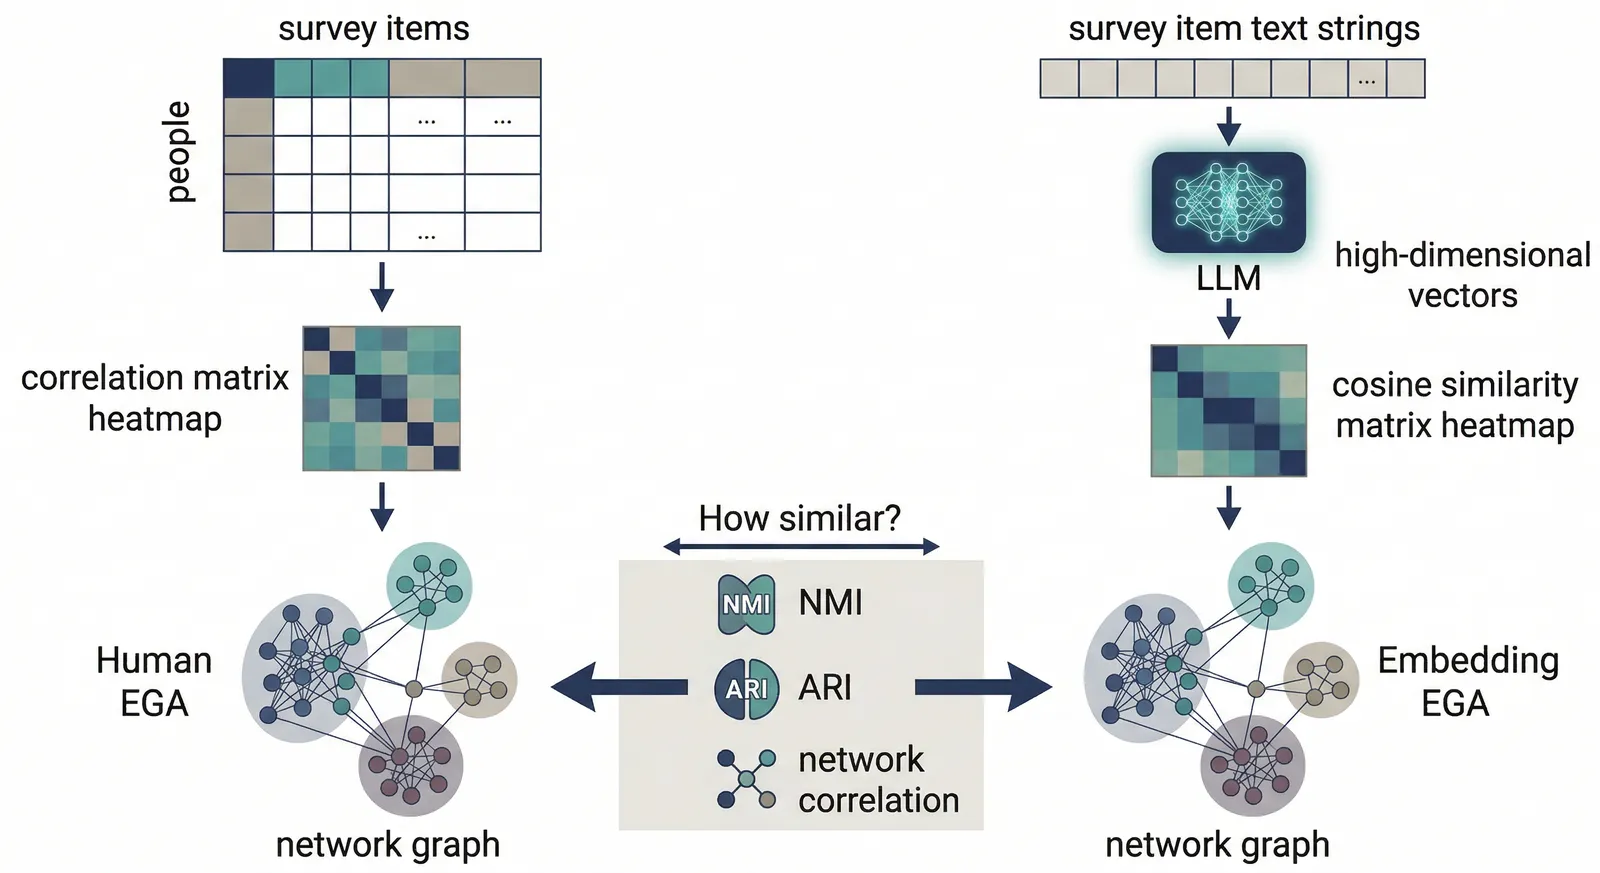
EGA treats survey items as nodes and their inter-relationships as edges, using network psychometrics to detect communities — the latent dimensions. The methodological insight is that LLM embeddings can be treated the same way:
- Human pathway: participant responses → Pearson/Spearman correlations → sparse network (glasso or TMFG) → community detection → latent dimensions.
- Embedding pathway: item text → LLM → high-dimensional vectors (384–3,072 dimensions) → cosine-similarity matrix → the same network algorithms → community detection → latent dimensions.
Both pathways produce a network over the same items, and the pipeline asks: does the community structure match? That reframes a construct-validity question — “does the LLM understand the latent structure of this instrument?” — as a tractable, quantitative comparison between two networks.
The pipeline
A configuration file drives an orchestrated series of R scripts — environment checks, data loading, embedding generation, EGA, and pairwise comparison — with configuration-aware caching at two stages: embeddings are reused when the model/dataset configuration is unchanged, and the whole analysis is skipped when both the embedding and EGA settings are unchanged, so iterating on comparison parameters takes seconds rather than repeat API calls.
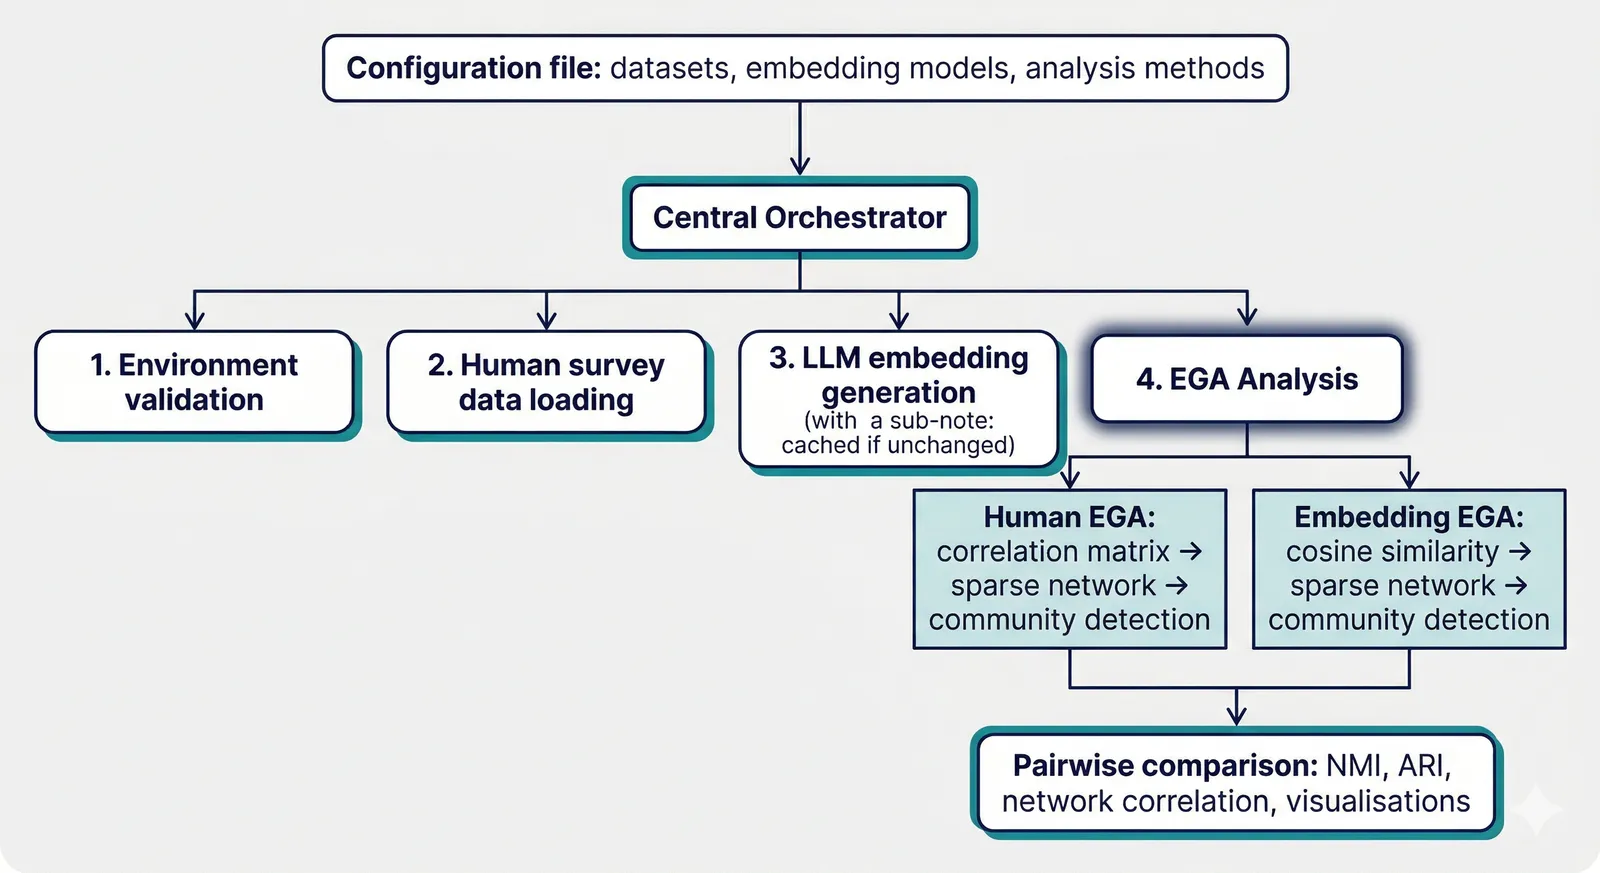
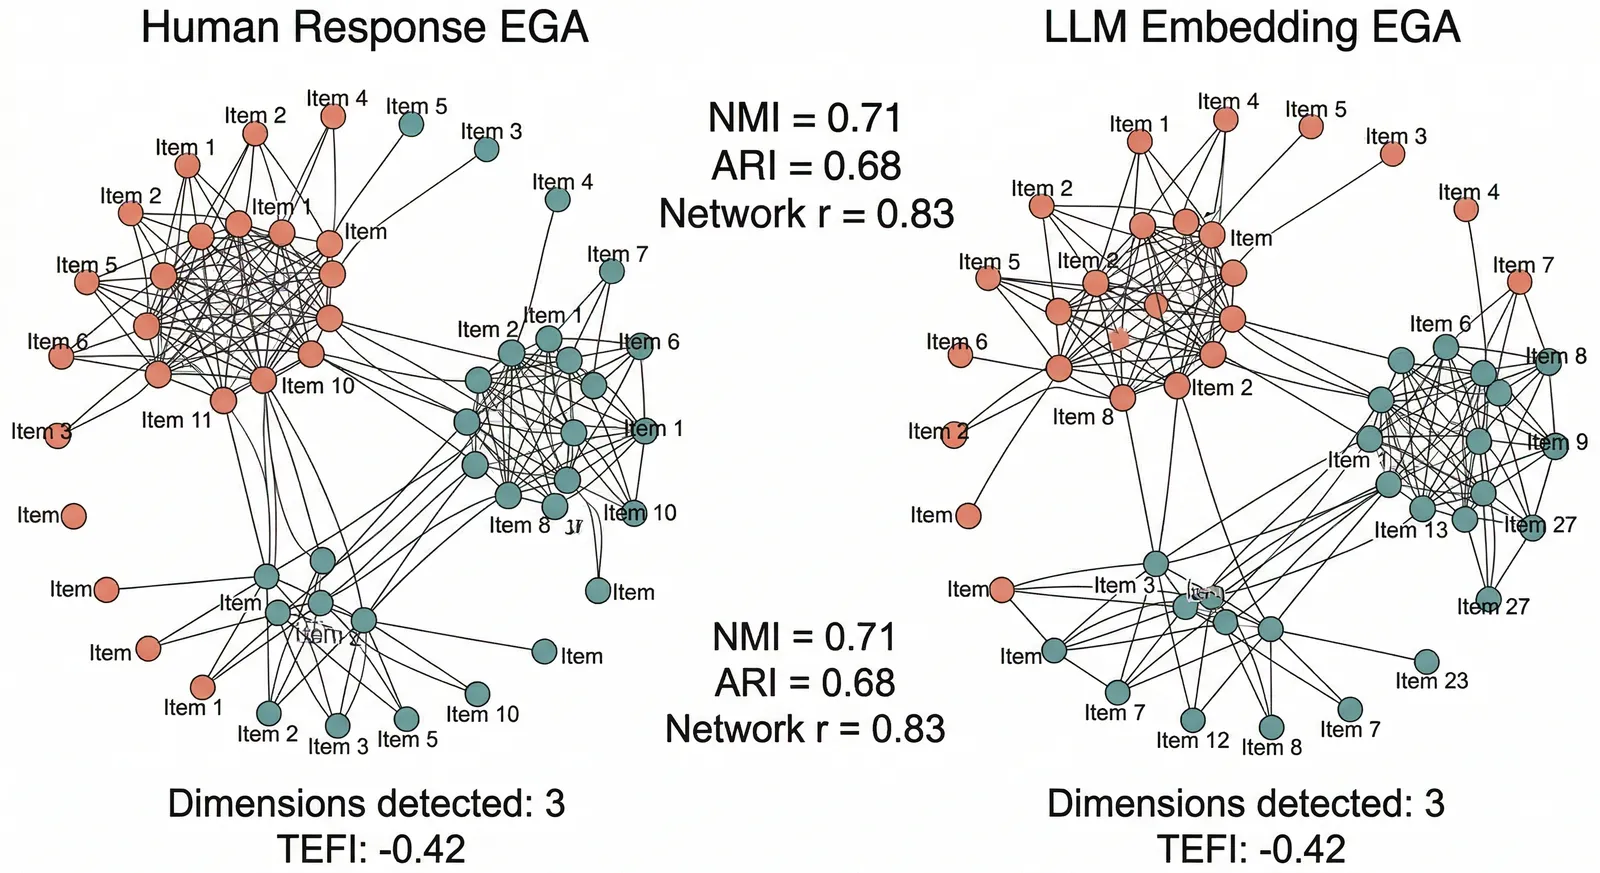
Human and embedding networks are then compared with a battery of metrics — Normalized Mutual Information (NMI), Adjusted Rand Index (ARI), edge-weight and node-strength correlations, items-switched percentage, and TEFI difference — alongside side-by-side network plots.
Factorial by design
Rather than committing to one analytic path, the tool systematically crosses
method choices — correlation/similarity metric (Pearson, Spearman, cosine),
network estimation (glasso, TMFG), community detection (walktrap, Louvain), and
bootstrapping — and compares every human method combination against every
LLM one for a scale. Findings are therefore not artefacts of a single analytic
choice: you can see how robust the human–LLM alignment is across the whole
“analytic garden.” Embedding sources range from cloud APIs (OpenAI
text-embedding-3-small/-large, Google text-embedding-004) to fully local
Sentence-BERT models (all-MiniLM-L6-v2, all-mpnet-base-v2) that run offline —
useful for sensitive clinical datasets.
How you might use it
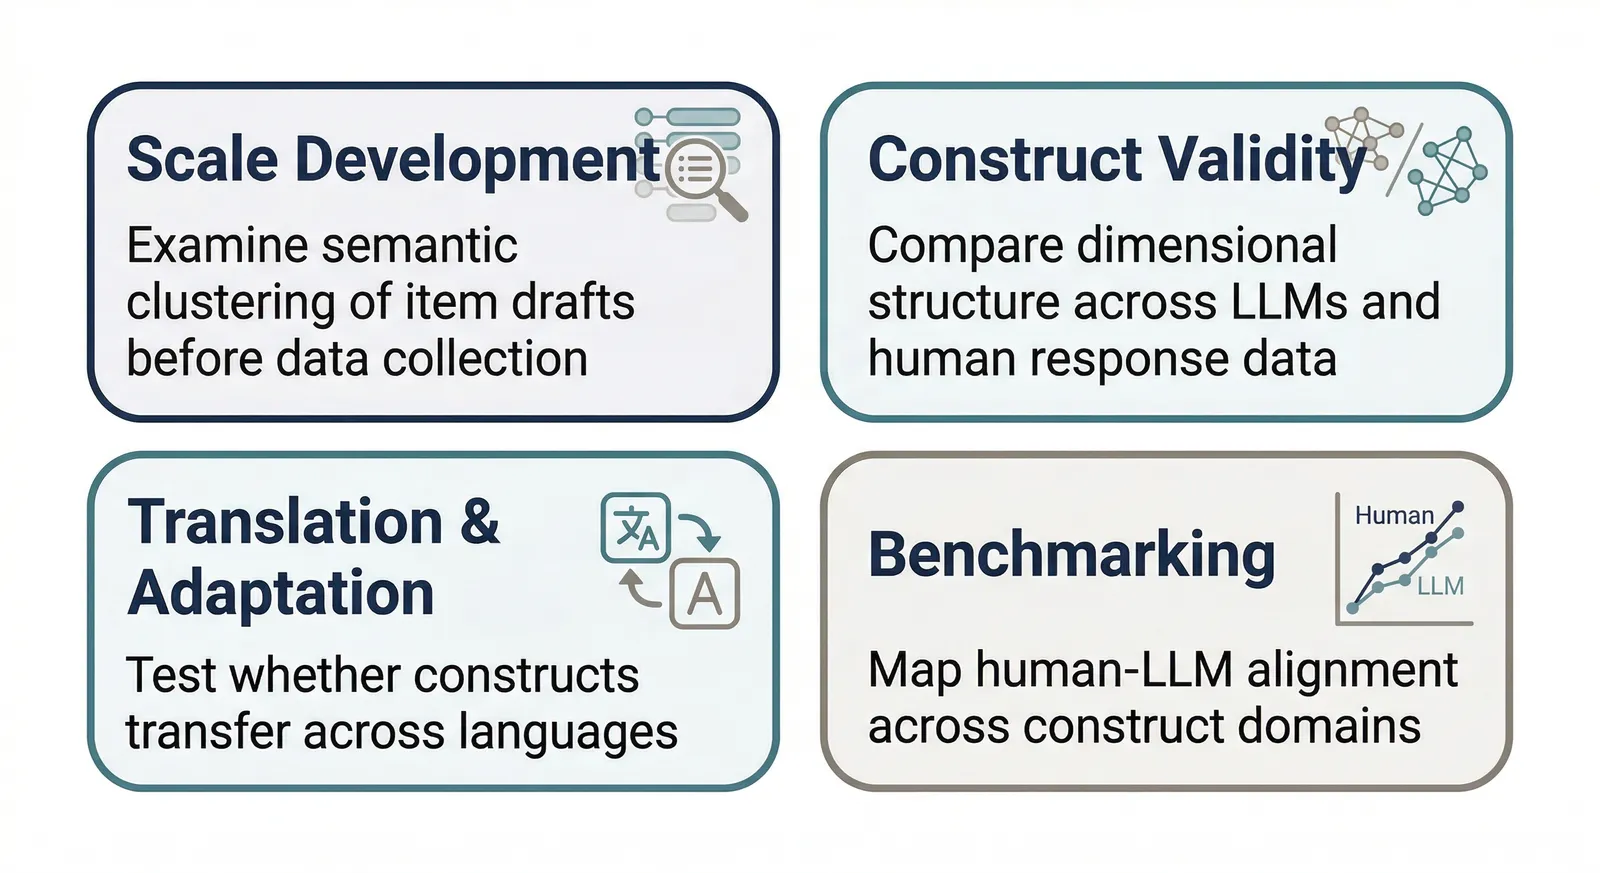
- Scale development & refinement — run embeddings over a draft item bank and check whether items cluster the way you intend before collecting data.
- Construct validity — see whether different LLMs agree on an established instrument’s dimensionality; divergence is itself informative.
- Cross-cultural & translation work — embed translated items and test whether the constructs “travel” relative to source-language human data.
- Exploratory benchmarking — map how human–LLM alignment varies across personality, psychopathology, and functioning.
- Teaching — comparing what a network “looks like” to human raters versus to an LLM makes latent structure tangible.
Status & involvement
The pipeline is fully functional; the code and an interactive results dashboard are being polished for a stable public release, with a manuscript in preparation. Collaborators are warmly welcomed — whether to contribute code, apply the pipeline to new datasets, co-develop the methodology, or explore research questions together. A stable version of the codebase is available on request: email [email protected].
Presented at the Society for Personality Assessment Annual Conference (Toronto, 2026). If you use or build on this work, please cite:
Monaghan, C., Donnelly, S., & Bizumic, B. (2026, March). Embedding-Enhanced Psychometrics: Comparing latent structure in LLM embeddings and human psychometric data using Exploratory Graph Analysis. Society for Personality Assessment Annual Conference, Toronto, Canada.
Built with R · EGAnet · OpenAI · Sentence-BERT · Google Gemini.